 Mohamed Salah
Population Camp Analysis
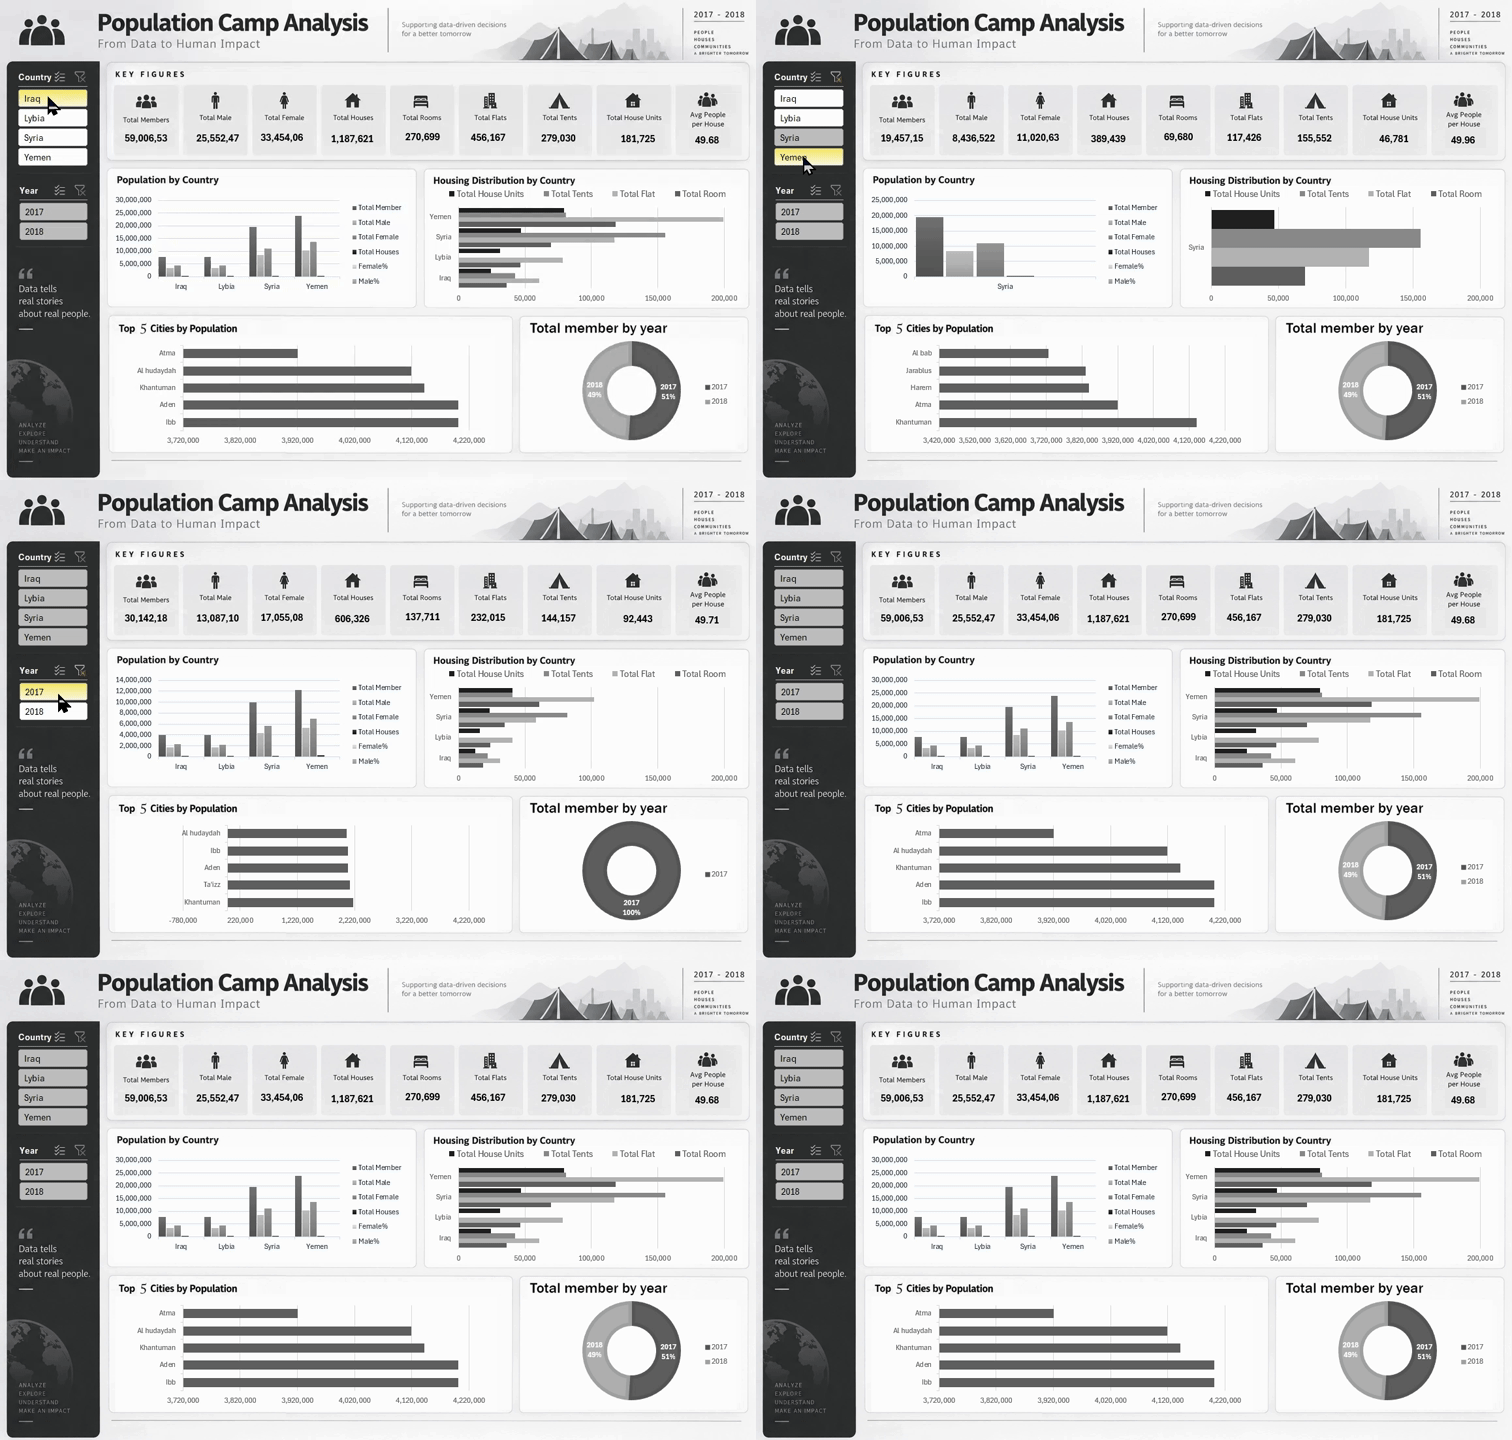
An interactive Excel dashboard analyzing population, demographics, housing, and yearly trends across countries and cities.
Tools Used
Project Overview
A data analysis project focused on transforming population camp data into meaningful insights through data cleaning, modeling, analysis, and visualization using Python and Excel.
The Problem
The raw dataset contained inconsistencies, missing values, duplicates, and data-quality issues that needed to be addressed before reliable analysis could be performed.
My Approach
I cleaned and prepared the data using Python and Power Query, built the data model and DAX measures with Power Pivot, and used PivotTables and PivotCharts to analyze population, demographics, housing, and yearly trends. The results were presented through an interactive Excel dashboard.
The Outcome
An interactive dashboard that provides a clear view of population distribution, gender composition, housing patterns, city rankings, and yearly population trends, making the data easier to explore and interpret.