 Mohamed Salah
Sales Performance Dashboard
An interactive Sales Performance Dashboard built in Excel to analyze revenue, orders, product performance, regional sales, and category contribution.
Tools Used
Project Overview
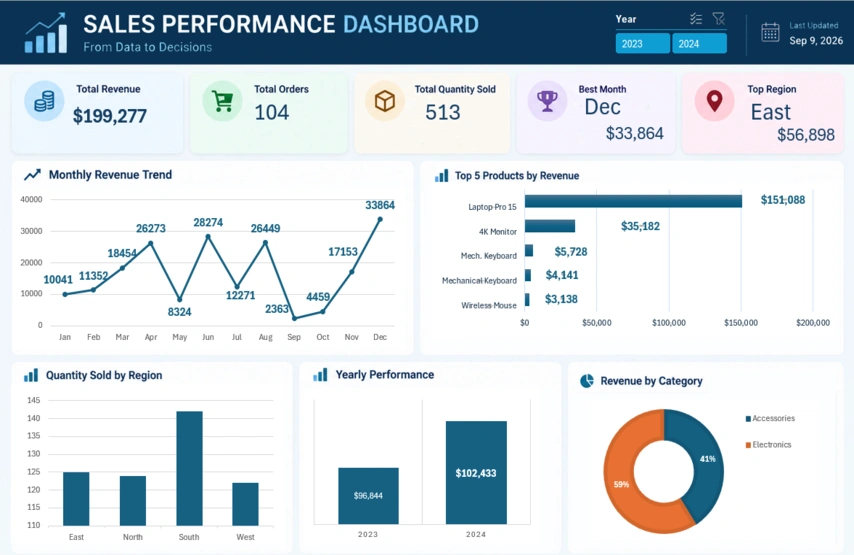
This project focuses on analyzing sales data and transforming raw data into meaningful business insights through an interactive Excel dashboard. The dashboard provides a clear view of revenue trends, product performance, regional performance, category contribution, and yearly sales performance, with interactive year filtering.
The Problem
The raw sales data contained detailed transaction-level information, making it difficult to quickly identify sales trends, top-performing products, and regional performance. The goal was to transform the raw data into a clear and interactive dashboard that makes key business insights easier to understand and support data-driven decisions.
My Approach
I followed a structured data analysis workflow using Excel: • Cleaned and transformed the raw data using Power Query. • Built the data model using Power Pivot. • Created relationships between the data tables. • Created calculated measures for key metrics such as Total Revenue. • Analyzed the data using PivotTables and PivotCharts. • Designed an interactive dashboard with KPIs, charts, and a Year slicer. • Identified key insights related to revenue trends, products, regions, and categories.
The Outcome
The final dashboard provides an interactive overview of sales performance, including: • $199,277 Total Revenue • 104 Total Orders • 513 Units Sold • Laptop Pro 15 as the top-performing product, generating $151,088 in revenue • East as the highest-revenue region with $56,898 • December as the highest-revenue month with $33,864 • 2024 revenue increased by approximately 5.8% compared with 2023 The project strengthened my practical skills in data cleaning, data modeling, analysis, and visualization using Excel.