 Mohamed Salah
Student Performance Analysis Dashboard
Interactive Power BI dashboard analyzing student academic performance, attendance, study behavior, and risk indicators to turn raw student data into actionable insights.
Tools Used
Project Overview
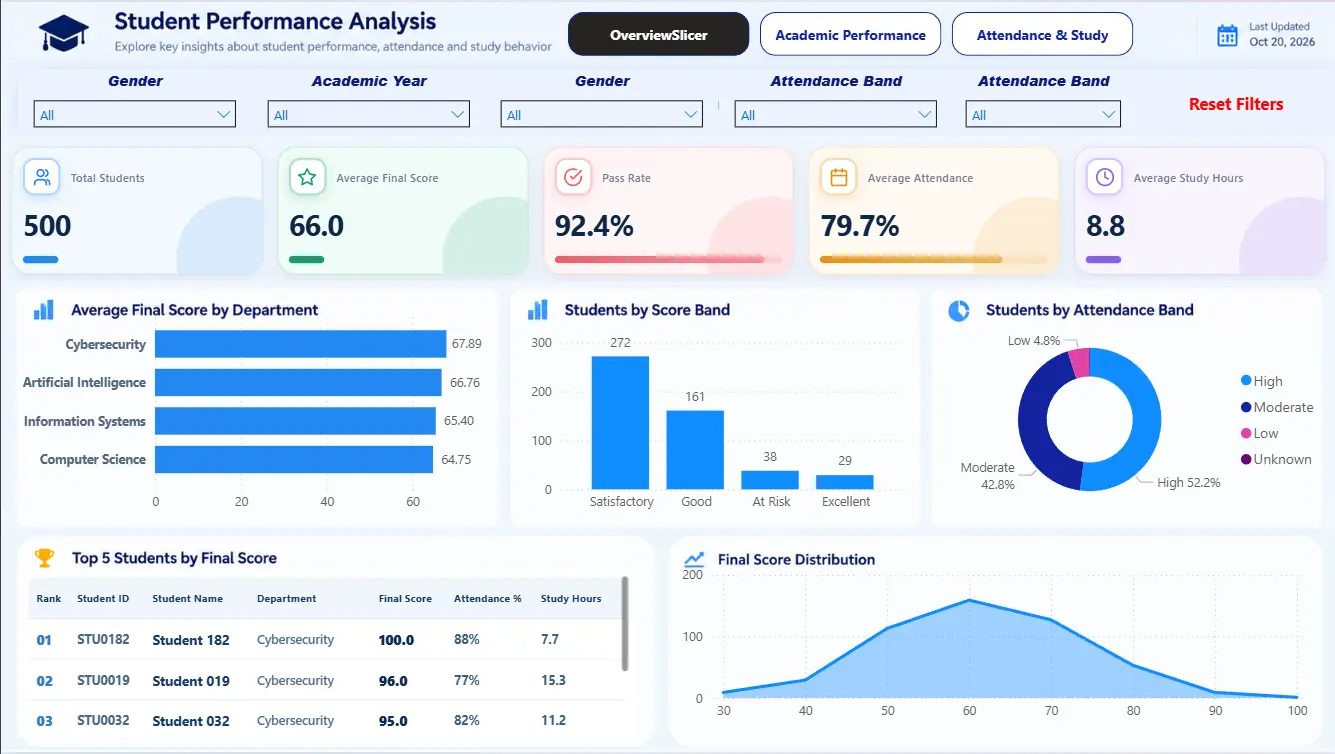
This project analyzes the academic performance of 500 students using Power BI. The dashboard provides an interactive view of final scores, attendance, study hours, assignment performance, departments, academic years, and student performance bands.
The Problem
Raw student data can make it difficult to identify performance patterns, understand academic outcomes, and quickly identify students who may be at risk. A clear and interactive dashboard was needed to transform the data into meaningful insights that are easy to explore and understand.
My Approach
I cleaned and transformed the data using Power Query, built the data model, and created DAX measures and calculated columns for key performance indicators. I then designed an interactive Power BI dashboard with KPIs, charts, filters, performance bands, and detailed student-level data.
The Outcome
The dashboard provides a clear overview of student performance and highlights key findings, including a 92.4% pass rate, 7.6% at-risk students, and 35.6% of students scoring 70 or above. It also helps compare departments, analyze attendance and study behavior, and identify performance patterns across different student groups.